A Walkthrough for the Weapon Dynamics Computer
The Weapon Dynamics Computer is intended to be a tool allowing for the transparent computation of the properties of hand-held weapons, swords in particular, from a standardised set of measurements. The tool computes numerical properties and also draws a graphical representation of certain aspects of the mass distribution.
Although the tool is hosted on the web, it operates entirely offline. There is no communication with any server whatsoever once the page has been loaded. The user is given the possiblity to easily share the data but there is no obligation to do so.
The computer is developed and tested on Linux with Firefox and Chromium (in the screenshots below) on this platform. I also test it regularly on Windows with Firefox and Chrome, and on Android with Chrome. In as much as possible, I try to use methods that are cross-platform, but I expect older browsers to have problems with some features. Also, Internet Explorer is absolutely unsupported as of now.
The tool is organised in several panels that rearrange themselves to keep usability depending on the display resolution and window size. The functions of each panel are described in this document.
Contents
Running computations
Entering measurements
Sword data can be entered in the 'Measurement' panel. Here is how it looks once filled with data that I just made up:
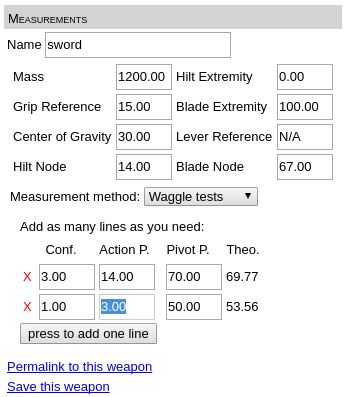
Here is an explanation of the data. There is one mass in grams, and several points whose position should be measured as signed distances in centimeters with respect to a common reference (the exact reference does not matter as long as it is unique for all the points):
- Name
- The name of the sword
- Mass
- The total mass of the sword
- Hilt extremity
- The point at the extremity of the sword on the hilt side
- Blade extremity
- The point at the extremity of the sword on the blade side (the tip in other words)
- Grip reference
- The point at the junction cross handle, which serves as the reference for the computation of some of the handling properties
- Center of Gravity
- The center of gravity of the sword
- Lever reference
- The point where leverage is applied. If left blank, it is picked 9cm from the grip reference towards the pommel.
- Hilt node
- The vibration node on the hilt side
- Blade node
- The vibration node on the blade side (also abusively called Center of Percussion)
Below this is the needed data to compute rotational inertia, a key aspect of dynamic behaviour. Two alternative methods are possible, selected with the list: waggle tests or pendulum tests. You can fill both, but only the selected, visible one will be used for the computation.
Waggle tests
For the waggle tests, the user must provide a list of pivot points pairs. There is one line for each pair, and lines can be added at will by pressing the button. On each line there are:
- Confidence (Conf.)
- The confidence on the measurement of this pair of pivot points. The higher the confidence, the more it will be taken into account in the computation. Confidences are relative; if you enter the same number for all pairs, no matter how big it is the result does not change. Confidences of 30, 10 have the same effect as 3, 1.
- Action point (Action P.)
- The point at which the sword was held during the waggle test. This measurement is supposed to be very accurate (a debatable assumption)
- Pivot point (Pivot P.)
- The point where there was no motion during the waggle test. The computation will try to fit to this value as closely as possible
We shall go over the Theoretical part in the next section!
Pendulum tests
Details of a possible experimental setup for pendulum tests can be read in this article.
For the pendulum tests, the user must provide a list of times measured at pivot points. The times measured must represent a given number of periods of oscillation, entered in the Number of periods timed field. As before, lines can be added at will by pressing the button. On each line there are:
- Pivot point
- The point around which the weapon is set to oscillate
- Time
- The time measured
Aside from these inputs, each lines includes a stopwatch. Just press the button and the stopwatch starts (the button becomes red). Press it again, and the stopwatch stops, and a dialog pops up for confirmation. If you accept the measurement it is automatically reported in the text field.
We shall go over the Error part in the next section!
Back to contentsComputed properties
From the measurements, the tool computes several numerical properties that are displayed in the 'Computed data' panel: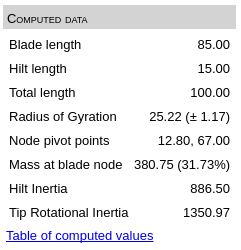
The computed properties are:
- Blade length
- The length of the blade from the grip reference to the tip
- Hilt length
- The length of the the hilt from grip reference to hilt extremity
- Total length
- The length from tip to hilt extremity
- Radius of Gyration
- The Radius of Gyration is a measure of how far on average the mass is from the center of gravity. It is directly related to the moment of inertia of the object, hence its significance for hand-held weapons. It is the key property of the mass distribution that correlates together all the pivot point pairs. Since the measurement of pivot points with the waggle test is ordinarily affected by some experimental error, a measure of the uncertainty on the RoG is computed and displayed as soon as several pairs are entered. An uncertainty of 1cm or below is ordinarily acceptable for waggle tests, and allows to meaningfully compare swords. With pendulum tests, you should get an even higher precision, less than 2mm.
- Node pivot points
- This is a pair of pivot points that are close to the vibration nodes
- Mass at blade node
- This is the effective mass of the sword at the blade node pivot point. It is expressed as an absolute value in grams, and a fraction of the total mass
- Hilt inertia
- The effective mass of the sword at the grip reference
- Tip Rotational Inertia
- This represents the maniability of the sword tip in rotation around the grip reference. It is expressed as a mass in grams, which relates the force applied at the lever point to the acceleration of the tip. The higher the number, the more difficult it is to move the tip.
In addition to these, for each pivot point a theoretical value is computed and displayed in the measurements panel. If there is too big a discrepancy between the practical and theoretical values, it might be a good idea to double check the centre of gravity and the pivot points. For pendulum tests, an error value is displayed for each measured time. If it becomes too big, more than 0.2s, or if it is biased depending on the location of the axis of rotation, there might be a problem with the pendulum device or the measurement of the center of gravity.
The properties are computed on the fly, and some properties need less data than others.
A table of computed values, for all the swords in the database, is built and accessible via the link in this panel.
Back to contentsThe diagram and its options
As data is being entered a diagram is build. That diagram represents both the measurements and the properties that can be computed based on them. The diagram for the measurements illustrated previously looks like this:

The light blue cross shape represents the sword, with the longitudinal axis horizontal and the tip to the right, the vertical bar being at the grip reference. The vertical black line marks the Center of Gravity. The blue area is the curve of the effective mass along the axis. The shapes in light gray represent the agility of the sword in rotation (hourglass) and translation (oval). The length of the curve at the tip is inversely proportional to the Tip Rotational Inertia.
Through the axis of the weapon you see several vertical red ticks. These are the locations of the action points and the associated theoretical pivot points. There are also red ellipses. These mark the location of the practical pivot points that have been measured. Their horizontal size is inversely proportional to the relative confidence of that pivot pair. Their opacity also reflects the confidence, so that a point with a very small confidence will result in an ellipse that is very transparent and very spread along the axis. That data appears on the graph as soon as you have entered something in waggle tests, even if the computation is done with pendulum tests. This gives a way to display pivot points even when you have not measured them.
On the blade there is a dark blue dashed line. This marks the location of the blade node. On the hilt above the sword's axis there is another similar line, that marks the measured hilt node. Under the axis, continuing in the effective mass curve, is a third dashed line that marks the pivot point associated to the blade node. Observing the offset between the last two lines shows how close the nodes are to being associated pivot points depending on the sword. On many examples, the hilt node and the blade node pivot are very close.
Clicking on the link above the diagram will start the 'download' of an SVG file. I'm putting quotes here because no data whatsover will transit over the network: the browser is simply letting you save the generated content. The SVG file should open in any decent vector graphic program: it can be edited in Inkscape for sure and Adobe Illustrator probably.
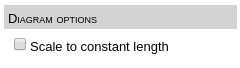
The scales of the diagram are written above it. There are two modes depending on what is checked in the Diagram Options panel. When the option 'Scale to constant length' is checked, the sword are scaled so that they all occupy the same length. When it is not checked, the scale of the diagram is the same for all the swords.
Working with databases
The tool has the capability to build a database of swords. This section outlines the management of that database. The management panel is this one:
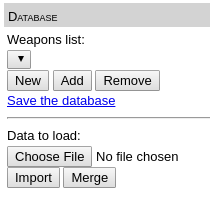
Adding swords
To add a sword to the database, simply give it a name and press the 'Add' button! If you make further edits to the measurements of that sword, press 'Add' again and it will update the data. You will be prompted for confirmation to avoid involuntary overwriting of precious data.
If you want to start a new sword from scratch, you can press the 'New' button.
Selecting and editing swords
There is a drop-down menu just under the 'Weapon list:' text. When you click it the whole list of the saved swords is displayed. You can then select a sword, which will update all the other elements: measurements, computed data, diagram.
You will be prompted for confirmation before switching to another existing sword, if you have made modifications to the data that have not been added to the base yet.
Once a sword is selected you can modify its measurements, and either update the current version (if you leave the name unchanged) or add it as a new element (when you have changed the name).
Removing swords
If desired, you can remove swords from the list by hitting the 'Remove' button. Again confirmation will be asked.
Back to contentsSaving and sharing
Once you have started a nice database of swords, you will probably want to save it and get back to it later to look at the data or expand it, or share with others. There are two main ways of doing this.
Sharing a single weapon
In the Measurements panel there is a clickable link labeled 'Permalink to this weapon'. Clicking it will pop-up a dialog proposing you to copy a link. Anyone you share this link with will be brought to the Dynamics Computer, filled with the data about your current sword. This is intended as a way to quickly and widely share data with the world. There is currently no attempt to ensure confidentiality when the recipient(s) follow the link, which means that you probably should not use this process if you want to share with selected individuals. In this case see the next section!
Here is an example of such a link.
Saving and importing databases
There are two links that allow you to save data. The first is in the Measurement panel, 'Save this weapon'. The second is in the Database pane, 'Save the database'. In both cases, they allow to save data as a JSON file, containing either just the current weapon or the whole database. It is then possible to share or store these files anyway you see fit. As with the diagram no data transits over the network, the browser is just letting you save local data.
The files can of course be loaded back into the tool. Clicking on the file selector under 'Data to load' will bring up a file dialog allowing you to pick a data file on your computer. Then you have two options:
- If you press the 'Import' button, the current database is erased and replaced by the imported data
- If you press the 'Merge' button, the weapons in the imported database are added to the current database. If some weapons are already present they are updated with the imported data
In both cases confirmation is sought to prevent data loss. You can test this now by loading this file. It contains a selection of my own swords measured with the waggle test and pendulum test.
I will strive to always keep compatiblity with these data files through the future versions of the tool, or at the very least provide conversion tools. As with any computer work, saving early and often is advised! When you load an old database version, an alert will pop up and warn you to save again.
Back to contents